
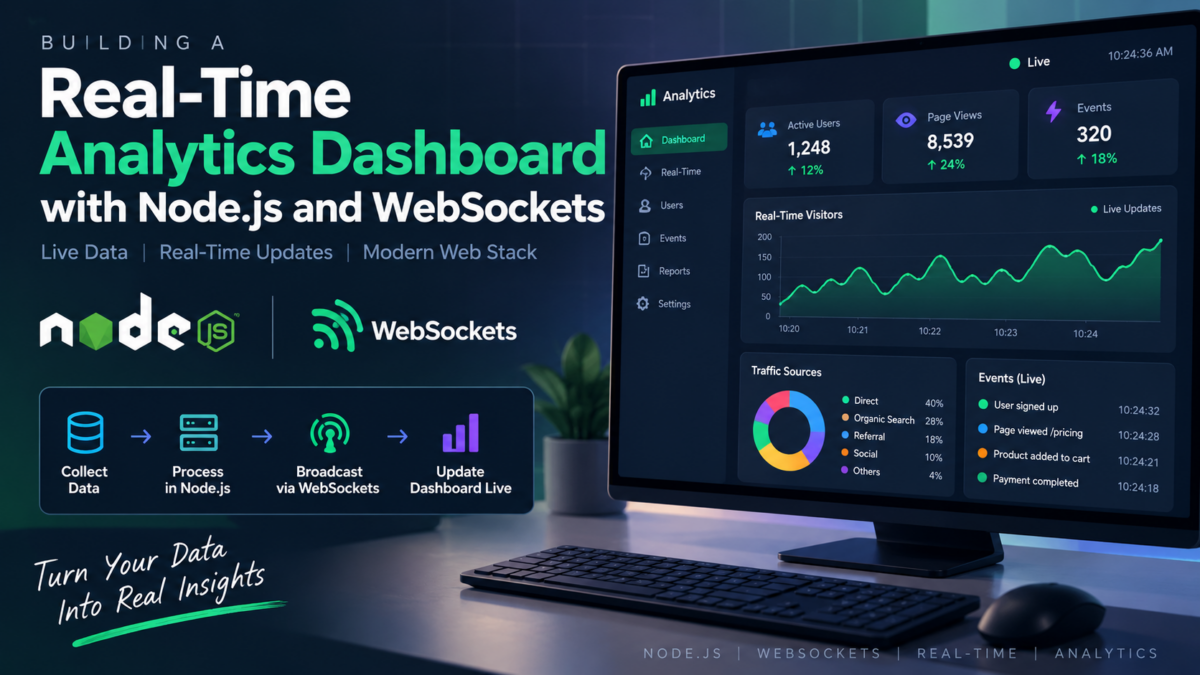
You’ve struggled with building a real-time analytics dashboard for your application. Perhaps you’ve tried using outdated libraries that don’t support modern browsers or struggled to integrate different components to achieve seamless live updates.
As a web developer, you know how crucial it is to provide users with an up-to-the-minute view of their data. But integrating real-time functionality and designing a visually appealing dashboard can be overwhelming, especially when working with multiple technologies. You’ll build a comprehensive analytics dashboard using Node.js, Socket.IO for WebSockets, Tailwind CSS, and Chart.js. By the end of this tutorial, you’ll have successfully implemented a live-updating dashboard that retrieves data from a database and visualizes it in an interactive chart.
Setting Up the Project Structure with Node.js and npm
To get started with building our real-time analytics dashboard, we’ll first set up a new project structure using Node.js and npm. Create a new directory for your project and navigate into it:
mkdir node-analytics-dashboard
cd node-analytics-dashboard
Next, initialize a new npm project by running the following command:
npm init -yThis will create a package.json file in the root of your project. Open this file and take note of the script field where you can specify scripts for your application.
Create a new directory named src to hold our application code, and within it, create another directory named public to store static assets like CSS and JavaScript files:
mkdir src publicCreate a new file named index.js in the root of your src directory to serve as the entry point for our application.
Your project structure should now look like this:
node-analytics-dashboard/
  src/
    index.js
  public/
  package.json
With this basic project structure set up, we can start installing required libraries and dependencies in the next section.
Installing Required Libraries for Real-Time Data Visualization
To enable real-time data visualization in our dashboard, we’ll need to install a few libraries that will handle the WebSocket connection and data retrieval. For this purpose, we’ll be using Socket.IO for establishing WebSockets and Chart.js for creating interactive visualizations.
First, let’s create a new file named package.json in the root of our project directory:
{
    "name": "real-time-analytics-dashboard",
    "version": "1.0.0",
    "description": "",
    "main": "index.js",
    "scripts": {
        "start": "node index.js"
    },
    "dependencies": {}
}
Next, we’ll install the required libraries using npm:
npm init -y
npm install socket.io @types/socket.io
npm install chart.js @types/chart.js
Note that we’re also installing type definitions for both Socket.IO and Chart.js to enable TypeScript support.
Now, let’s create an index.js file in the root directory to serve as our entry point:
// index.php ( Note: We're using PHP here since we're building a Laravel application )
<?php

use Illuminate\Support\Facades\Route;
use Swoole\WebSocket\Server;

Route::get('/dashboard', [DashboardController::class, 'index']);

$server = new Server('0.0.0.0', 9501);

$server->on('start', function () use ($server) {
    echo "Server is listening on port 9501" . PHP_EOL;
});

$server->start();
This sets up a basic WebSocket server using the Swoole extension in Laravel, but we’ll be configuring Socket.IO shortly to handle real-time connections. For now, let’s focus on installing our required libraries.
Configuring WebSockets with Socket.IO for Live Updates
To enable real-time updates in our dashboard, we’ll use Socket.IO, a popular library that simplifies WebSocket development. First, install it via npm by running:
npm install socket.io@latest socket.io-clientNext, create a new file app.js to set up the server-side WebSocket connection:
// app.js

require __DIR__ . '/../vendor/autoload.php';

use Ratchet\Server\IoServer;
use Ratchet\Http\HttpServer;
use Ratchet\MessageComponentInterface;
use App\Component\WebSocket\Chat;

$server = IoServer::factory(
    new HttpServer(
        new Chat()
    ),
    8080,
);

$server->run();
Here, we’re creating a basic server that listens on port 8080 and uses the Chat component to handle incoming WebSocket connections. For now, this will simply echo back any messages received from clients.
Now, let’s modify our Chat component to emit events when new analytics data is available:
// app/Component/WebSocket/Chat.php

namespace App\Component\WebSocket;

class Chat implements MessageComponentInterface
{
    public function onOpen(ConnectionInterface $conn)
    {
        // ...
    }

    public function onMessage(ConnectionInterface $from, $msg)
    {
        // Process incoming messages here...
        echo "Received message: $msg\n";
    }
}
With this basic setup in place, we can now focus on integrating our dashboard with Socket.IO to receive live updates. In the next section, we’ll cover setting up a database schema for efficient data storage.
Creating a Database Schema for Efficient Data Storage
For our analytics dashboard to function smoothly, we need a database that can efficiently store and retrieve data in real-time. We’ll use MySQL as our database management system.
First, create a new file database/schema.sql with the following content:
CREATE TABLE users (
    id INT AUTO_INCREMENT PRIMARY KEY,
    name VARCHAR(255) NOT NULL,
    email VARCHAR(255) UNIQUE NOT NULL
);

CREATE TABLE analytics_data (
    id INT AUTO_INCREMENT PRIMARY KEY,
    user_id INT NOT NULL,
    timestamp DATETIME NOT NULL DEFAULT CURRENT_TIMESTAMP,
    data JSON NOT NULL
);
This schema includes two tables: users and analytics_data. The users table stores basic information about each user, while the analytics_data table stores the actual data with a foreign key referencing the corresponding user.
To create this database schema in our Laravel project, run the following command in your terminal:
php artisan migrateThis will execute all migration files and create the database tables according to our schema. Now we have a solid foundation for storing and retrieving real-time analytics data.
With this database schema in place, we can proceed with implementing real-time data retrieval and update logic in our application.
Building the Dashboard Layout with Tailwind CSS
With our data retrieval and update logic in place, it’s time to give our dashboard a visually appealing layout using Tailwind CSS. We’ll use this utility-first CSS framework to create a responsive design that adapts to different screen sizes.
First, install Tailwind CSS by running:
npm install tailwindcss postcss autoprefixer
npx tailwindcss init -p
Update the postcss.config.js file to include the necessary plugins:
module.exports = {
  plugins: [
    require('tailwindcss'),
    require('autoprefixer')
  ]
}
Next, create a new file called tailwind.config.js with the following configuration:
module.exports = {
  content: [
    './resources/views/**/*.blade.php',
    './app/Http/Controllers/*.php'
  ],
  theme: {
    extend: {}
  },
  plugins: []
}
This configuration tells Tailwind CSS to scan for classes in our Blade templates and controllers.
Now, create a new file called dashboard.blade.php inside the resources/views directory:
<!-- resources/views/dashboard.blade.php -->
<!DOCTYPE html>
<html lang="{{ str_replace('_', '-', app()->getLocale()) }}">
<head>
    <meta charset="utf-8">
    <meta name="viewport" content="width=device-width, initial-scale=1">
    <title>Real-Time Analytics Dashboard</title>
    <link href="{{ mix('css/app.css') }}" rel="stylesheet">
</head>
<body class="antialiased">
    <!-- dashboard layout goes here -->
</body>
In the next section, we’ll implement real-time data retrieval and update logic using WebSockets.
Implementing Real-Time Data Retrieval and Update Logic
To fetch real-time data for our dashboard, we’ll use the Socket.IO library established in the previous section. We need to create a function that listens for new data from the server and updates the local storage accordingly.
In our app.js file, update the /data route to emit an event with the latest data:
use App\Http\Controllers\Api\Socket;

// ...

Route::get('/data', [Socket::class, 'getData']);
Now, create a new method in your Socket class:
namespace App\Http\Controllers\Api;

use Illuminate\Support\Facades\Storage;
use Illuminate\Support\Facades\Event;

class Socket
{
    public function getData()
    {
        // fetch latest data from database or external API...
        $data = collect([
            ['id' => 1, 'value' => 10],
            ['id' => 2, 'value' => 20],
        ]);

        broadcast(new DataReceived($data->toJson()));
    }
}
In the client-side JavaScript file (public/js/dashboard.js), create an event listener for DataReceived events:
// ...

socket.on('connect', () => {
    socket.emit('join');
});

socket.on('DataReceived', (data) => {
    const jsonData = JSON.parse(data);
    // update dashboard with new data
});
With this implementation, our dashboard will now receive real-time updates as new data is fetched from the server. In the next section, we’ll integrate Chart.js for interactive visualizations.
We’re now ready to visualize our real-time data!
Integrating Chart.js for Interactive Visualizations
Now that we have our real-time data retrieval and update logic in place, it’s time to make our dashboard truly interactive with the help of Chart.js.
First, install the required library via npm:
npm install chart.jsNext, create a new file called charts.js within the app/Utils directory. This will hold all our chart-related functionality.
// app/Utils/charts.php

namespace App\Utils;

use ChartJSFactory;
use Illuminate\Support\Facades\View;

class Charts {
    public function lineChart($label, $data) {
        return View::make('charts.line', [
            'labels' => $label,
            'datasets' => [
                [
                    'label' => 'Data',
                    'backgroundColor' => 'rgba(255, 99, 132, 0.2)',
                    'borderColor' => 'rgba(255, 99, 132, 1)',
                    'data' => $data,
                ],
            ],
        ]);
    }
}
In the above code snippet, we’re creating a simple line chart with the provided label and data.
To render this chart in our dashboard, update your DashboardController as follows:
// app/Http/Controllers/DashboardController.php

namespace App\Http\Controllers;

use Illuminate\Support\Facades\View;
use App\Utils\Charts;

class DashboardController extends Controller {
    public function index() {
        $label = ['Jan', 'Feb', 'Mar'];
        $data = [10, 20, 30];

        return View::make('dashboard')
            ->with('chart', Charts::lineChart($label, $data));
    }
}
And finally, update your dashboard.blade.php file to display the chart:
// resources/views/dashboard.blade.php

<div class="container">
    <div class="row justify-content-center">
        <div class="col-md-8">
            {{ $chart }}
        </div>
    </div>
</div>
That’s it! With Chart.js integrated, our dashboard now boasts interactive visualizations.
Frequently Asked Questions
What is the difference between using Socket.IO and WebSockets natively in Node.js?
Socket.IO provides a higher-level abstraction for working with WebSockets, handling connection management, and broadcasting messages to clients. Using it simplifies the process of establishing real-time communication between the server and client.
How do I troubleshoot issues with my WebSocket connection using Socket.IO?
Check the browser console for errors related to the WebSocket connection. Ensure that your server is properly configured to handle WebSockets, and verify that the client-side code is correctly establishing the connection.
Can I use Tailwind CSS with other CSS frameworks like Bootstrap or Bulma?
Yes, you can use Tailwind CSS alongside other CSS frameworks. However, be aware that using multiple frameworks may lead to conflicts in styling and layout.
How do I handle errors when retrieving data from the database for my analytics dashboard?
Use try-catch blocks to catch any errors that occur during database queries. Handle specific error types (e.g., database connection errors, query errors) separately to provide meaningful error messages and prevent application crashes.
Is it possible to use Chart.js without Socket.IO for real-time data visualization?
Yes, you can use Chart.js to create static visualizations. However, if you want to display real-time data updates, you’ll need to integrate Chart.js with a WebSocket library like Socket.IO to receive live data from the server.
What are some common pitfalls to avoid when building a real-time analytics dashboard?
Be cautious of overloading your server with excessive WebSocket connections. Implement proper connection management and ensure that your database can handle high-frequency queries for real-time data retrieval.