
Building complex isometric visualizations for your web projects can be a challenging task, especially when you need to ensure they are both interactive and performant. Many developers struggle with the intricate details of setting up an isometric grid and implementing smooth transformations.
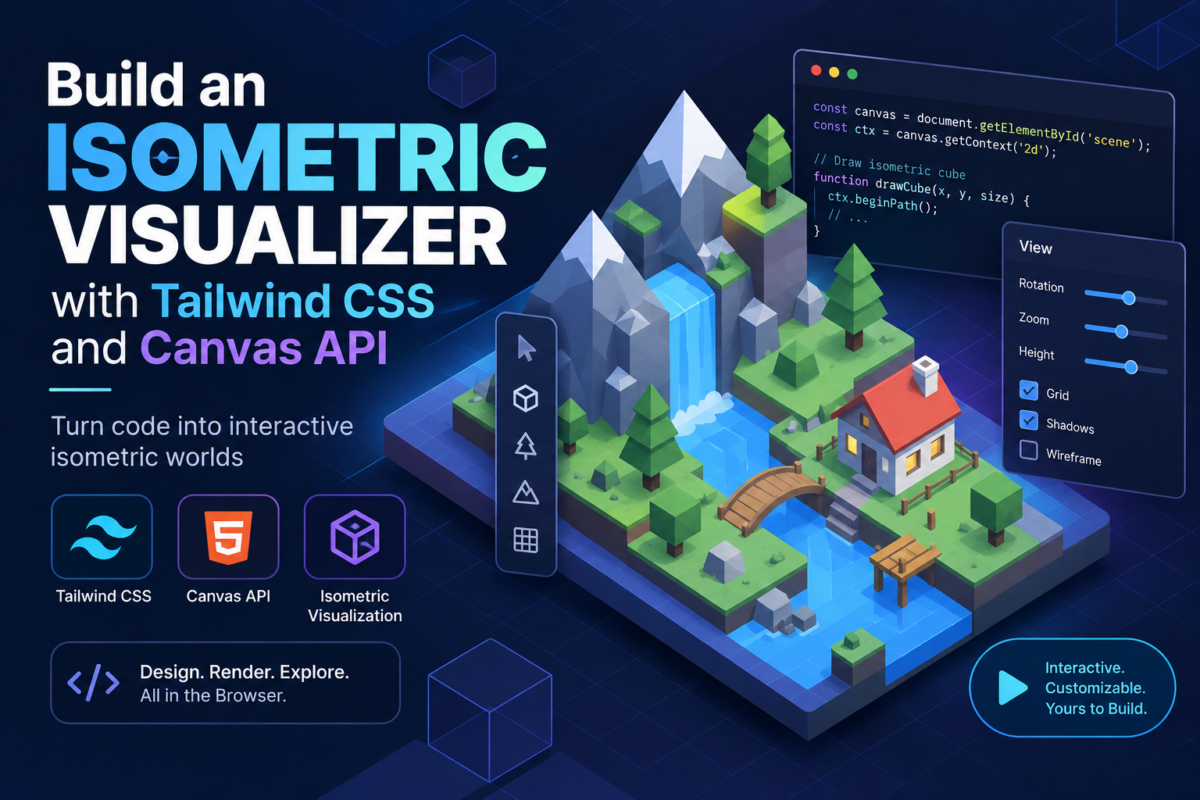
By the end of this tutorial, you’ll have built a fully functional isometric visualizer using Tailwind CSS for the user interface and canvas API for rendering. You’ll learn how to create an isometric grid and handle user inputs to manipulate the visualizer in real-time, ensuring a smooth and interactive user experience.
Installing Dependencies and Setting Up the Project
To get started with creating an isometric visualizer, you need to set up a Laravel project and install the necessary dependencies. I’ll walk you through the steps to ensure your development environment is ready.
First, install Composer globally if you haven’t already. Then, use Composer to create a new Laravel project:
composer create-project --prefer-dist laravel/laravel isometric-visualizerNavigate to your project directory:
cd isometric-visualizerNext, install Tailwind CSS, which will be used for styling. Tailwind CSS is a utility-first CSS framework that provides a lot of flexibility and ease in designing the user interface for your isometric visualizer.
Install Tailwind CSS and its dependencies:
composer require tailwindcss/tailwindcss
npm install
npm install tailwindcss postcss autoprefixer
npx tailwindcss init -p
After initializing Tailwind CSS, you need to set up a basic configuration file for Tailwind CSS. Update the tailwind.config.js file to include your project’s directories:
module.exports = {
    content: [
        './resources/**/*.blade.php',
        './resources/**/*.js',
        './resources/**/*.vue',
    ],
    theme: {
        extend: {},
    },
    plugins: [],
}
Tailwind CSS also needs to be included in your Laravel project’s build process. Add the following lines to your webpack.mix.js file to compile Tailwind CSS:
require('tailwindcss/postcss.config.js');
const mix = require('laravel-mix');

mix.js('resources/js/app.js', 'public/js')
   .postCss('resources/css/app.css', 'public/css', [
       require('tailwindcss'),
       require('autoprefixer'),
   ]);
Finally, generate the initial Tailwind CSS file and create a basic stylesheet:
npx tailwindcss build resources/css/app.css -o public/css/app.cssNow that you have Tailwind CSS set up, you can proceed to design the user interface for your isometric visualizer.
Designing the User Interface with Tailwind CSS
To design the user interface for our isometric visualizer, we’ll use Tailwind CSS, a utility-first CSS framework that allows us to rapidly prototype and build interfaces with minimal configuration.
First, ensure you have Tailwind CSS installed in your Laravel project. If it’s not already set up, you can install it via npm:
npm install tailwindcss postcss autoprefixer
npx tailwindcss init -p
Next, update your resources/css/app.css file to include Tailwind directives:
@tailwind base;
@tailwind components;
@tailwind utilities;
Now, let’s create the basic structure of our visualizer. We’ll start by setting up a container for our canvas and adding some basic styling to ensure everything is centered and responsive:
<div id="isometric-visualizer" class="flex items-center justify-center min-h-screen bg-gray-100">
    <canvas id="isometric-canvas"></canvas>
</div>
In this structure, the isometric-visualizer div acts as the main container, centering the canvas both vertically and horizontally on the page. The isometric-canvas is the actual HTML5 canvas element where we’ll draw our isometric grid.
Let’s add some additional styles to make the visualizer look better and more interactive. For example, you might want to add a border around the canvas and some padding for better spacing:
<div id="isometric-visualizer" class="flex items-center justify-center min-h-screen bg-gray-100 p-4">
    <canvas id="isometric-canvas" class="border-2 border-gray-400"></canvas>
</div>
We’ll also need to include the Tailwind CSS file in our Laravel view. Assuming you’re using Blade templates, update your resources/views/layouts/app.blade.php to include Tailwind:
<!DOCTYPE html>
<html>
<head>
    <meta charset="UTF-8">
    <meta name="viewport" content="width=device-width, initial-scale=1.0">
    <title>Isometric Visualizer</title>
    <link href="/css/app.css" rel="stylesheet">
</head>
<body>
    @yield('content')
</body>
</html>
With this setup, your visualizer should have a basic and responsive UI. Tailwind’s utility classes make it easy to adjust the layout and styling as your visualizer evolves.
Initializing the Canvas and Context
To start working on the isometric visualizer, the first step is to initialize the HTML canvas element and its rendering context. This will allow us to draw shapes and manipulate graphics within the canvas. We’ll use JavaScript to handle these operations.
First, create an HTML file in the resources/views directory of your Laravel project, say isometric_visualizer.blade.php. Add a basic HTML structure with a <canvas> element:
<!DOCTYPE html>
<html lang="en">
<head>
    <meta charset="UTF-8">
    <meta name="viewport" content="width=device-width, initial-scale=1.0">
    <title>Isometric Visualizer</title>
    <link href="/css/app.css" rel="stylesheet">
</head>
<body>
    <canvas id="isometricCanvas" width="800" height="600"></canvas>
    <script src="/js/app.js"></script>
</body>
</html>
In this setup, we define a <canvas> element with an ID of isometricCanvas. We specify the width and height of the canvas, which will be the dimensions we’ll use for rendering our isometric grid. We also include a link to our main stylesheet and a script tag to include our JavaScript code.
Next, in your Laravel project’s public directory, create a JavaScript file resources/js/app.js and initialize the canvas and its context. Here’s an example of how to do this:
document.addEventListener('DOMContentLoaded', (event) => {
    const canvas = document.getElementById('isometricCanvas');
    const ctx = canvas.getContext('2d');

    // Basic canvas setup
    ctx.strokeStyle = '#000000';
    ctx.lineWidth = 1;

    // Example drawing a line
    ctx.beginPath();
    ctx.moveTo(50, 50);
    ctx.lineTo(150, 150);
    ctx.stroke();
});
This script waits for the DOM to be fully loaded before initializing the canvas context. We retrieve the <canvas> element and its 2D rendering context. Then, we set the stroke style and line width for drawing. Finally, we demonstrate drawing a line from point (50,50) to point (150,150) on the canvas.
With this setup, you have a basic isometric visualizer foundation to build upon. In the next section, we’ll start creating the isometric grid.
Creating the Isometric Grid
Now that we have the canvas initialized and the Tailwind CSS framework set up, we can proceed to create the isometric grid. This involves calculating the positions and dimensions for the grid lines and plotting them on the canvas.
First, let’s define the dimensions and orientation of our grid. We’ll use a 16×16 grid with each tile having a size of 50×50 pixels. Isometric grids are typically rotated 45 degrees, so we need to account for this when drawing the grid lines.
Create a new file src/Services/IsometricGrid.php and define a service class to handle grid rendering:
<?php

namespace App\Services;

class IsometricGrid
{
    private $width = 50;
    private $height = 50;
    private $gridSize = 16;

    public function draw($context)
    {
        $this->drawHorizontalGrid($context);
        $this->drawVerticalGrid($context);
    }

    private function drawHorizontalGrid($context)
    {
        for ($i = 0; $i <= $this->gridSize; $i++) {
            $y = $i * $this->height / 2 + $i * $this->height / 2;
            $context->moveTo(0, $y);
            $context->lineTo($this->gridSize * $this->width, $y);
            $context->stroke();
        }
    }

    private function drawVerticalGrid($context)
    {
        for ($i = 0; $i <= $this->gridSize; $i++) {
            $x = $i * $this->width / 2 - $i * $this->height / 2;
            $context->moveTo($x, 0);
            $context->lineTo($x, $this->gridSize * $this->height);
            $context->stroke();
        }
    }
}
In the draw method, we call two helper methods: drawHorizontalGrid and drawVerticalGrid. These methods iterate through the grid size and calculate the positions of each line based on the isometric transformation.
Next, integrate this grid drawing into your canvas rendering logic. Modify your JavaScript file to use the IsometricGrid service when initializing the canvas:
import { IsometricGrid } from './IsometricGrid';

const canvas = document.getElementById('isometric-canvas');
const ctx = canvas.getContext('2d');

const grid = new IsometricGrid();
grid.draw(ctx);
This setup ensures that the isometric grid is drawn on the canvas when the page loads, providing a foundation for further visual elements and interactions.
Implementing Isometric Transformations
Implementing isometric transformations involves adjusting the position and dimensions of elements to create the illusion of depth and perspective. We’ll focus on rotating and scaling elements to fit the isometric grid, which we created in the previous section.
First, let’s define a utility function to rotate points in the isometric space. This function will take coordinates and the rotation angle as input and return the transformed coordinates.
function rotatePoint(array $point, float $angle): array
{
    [$x, $y] = $point;
    $cos = cos($angle);
    $sin = sin($angle);
    return [
        round($x * $cos - $y * $sin),
        round($x * $sin + $y * $cos)
    ];
}
Next, we’ll implement a function to scale and position elements based on their isometric coordinates. This function will adjust the element’s dimensions and location to fit the grid properly.
function isometricTransform(array $point, float $width, float $height): array
{
    [$x, $y] = $point;
    return [
        round($x * ($width / 2)),
        round(($y * ($height / 2)) - ($x * ($height / 2)))
    ];
}
To apply these transformations, we’ll create a new class for isometric elements and use the functions above to set up their properties.
class IsometricElement
{
    public function __construct(public array $position, public float $width, public float $height, public float $angle = 0)
    {
    }

    public function transform(): array
    {
        $transformedPosition = isometricTransform($this->position, $this->width, $this->height);
        $rotatedPosition = rotatePoint($transformedPosition, $this->angle);
        return $rotatedPosition;
    }
}
Finally, we’ll create a method to draw the element on the canvas using its transformed position and dimensions.
public function draw(Canvas $canvas): void
{
    $transformedPosition = $this->transform();
    $canvas->drawRect($transformedPosition[0], $transformedPosition[1], $this->width, $this->height);
}
With these functions and classes, you can now create and manipulate isometric elements dynamically. Adjust the position, size, and rotation of elements to fit your visualizer’s requirements.
Adding Interactivity and User Inputs
To make the isometric visualizer interactive, we need to handle user inputs such as mouse movements, clicks, and keyboard events. These inputs will allow users to manipulate the grid and visualize data dynamically.
First, let’s add event listeners for mouse movements and clicks. We’ll use JavaScript’s addEventListener method to bind these events to the canvas element.
document.addEventListener('DOMContentLoaded', () => {
    const canvas = document.getElementById('isometricCanvas');
    const context = canvas.getContext('2d');
    const grid = new IsometricGrid(canvas.width, canvas.height, context);

    // Add mousemove event listener
    canvas.addEventListener('mousemove', (event) => {
        const rect = canvas.getBoundingClientRect();
        const x = event.clientX - rect.left;
        const y = event.clientY - rect.top;
        grid.highlightCell(x, y);
    });

    // Add click event listener
    canvas.addEventListener('click', (event) => {
        const rect = canvas.getBoundingClientRect();
        const x = event.clientX - rect.left;
        const y = event.clientY - rect.top;
        grid.selectCell(x, y);
    });
});
In the above code, highlightCell and selectCell are methods of the IsometricGrid class. highlightCell highlights the cell under the mouse cursor, and selectCell performs an action based on the cell’s position.
Next, let’s add keyboard event listeners for navigation and other interactions. For example, pressing the arrow keys could move the viewport, and pressing a specific key could toggle between different visualizations.
document.addEventListener('keydown', (event) => {
    const keys = {
        LEFT: 37,
        UP: 38,
        RIGHT: 39,
        DOWN: 40,
        SPACE: 32,
    };

    if (event.keyCode === keys.LEFT) {
        grid.moveViewport(-10, 0);
    } else if (event.keyCode === keys.RIGHT) {
        grid.moveViewport(10, 0);
    } else if (event.keyCode === keys.UP) {
        grid.moveViewport(0, -10);
    } else if (event.keyCode === keys.DOWN) {
        grid.moveViewport(0, 10);
    } else if (event.keyCode === keys.SPACE) {
        grid.toggleVisualization();
    }
});
Here, moveViewport adjusts the position of the grid, and toggleVisualization switches between different visual representations of the data. These methods should be defined within the IsometricGrid class to handle the logic for each interaction.
By implementing these event listeners and methods, the visualizer becomes interactive, allowing users to explore and manipulate the isometric grid effectively.
Optimizing Performance and Responsiveness
Optimizing the performance and responsiveness of your isometric visualizer is crucial for ensuring a smooth user experience. Here are several strategies to achieve this:
Reduce Redundant Repainting: Avoid unnecessary calls to requestAnimationFrame by tracking which elements need to be updated. Use flags or states to determine if the redraw is necessary. For example:
$shouldRedraw = false;

// Inside your main loop
function mainLoop() {
    if ($shouldRedraw) {
        // Perform your rendering logic
        $shouldRedraw = false;
    }
    requestAnimationFrame('mainLoop');
}
This approach ensures that you only render when something has changed, reducing the load on the browser.
Batch Updates: If your visualizer updates multiple elements, consider batching these updates into a single render call to minimize the number of repaints.
function batchUpdates($elements) {
    foreach ($elements as $element) {
        $this->updateElement($element);
    }
    $this->renderAll();
}
This method is especially useful in scenarios where multiple elements need to be updated in response to a single user action.
Optimize Event Handling: Use event delegation to handle events on many elements with a single event listener. This reduces the number of event listeners and improves performance.
document.getElementById('container').addEventListener('click', function(event) {
    const target = event.target;
    if (target.classList.contains('interactive')) {
        // Handle click event
    }
});
This technique is particularly effective for elements that are dynamically added to the DOM.
Minimize DOM Manipulation: Reduce direct DOM manipulation by creating a virtual DOM or by updating the DOM in bulk rather than individual elements.
$container = document.getElementById('container');
$container.innerHTML = $this->renderElements(); // Render all elements at once
By minimizing DOM updates, you reduce the overhead of browser reflows and repaints.
Implement Lazy Loading: If your visualizer loads a large dataset, consider implementing lazy loading to load only the necessary data for the currently visible area. This improves initial load times and performance.
function loadVisibleData($visibleArea) {
    // Load data for the currently visible area
}
By applying these optimizations, your isometric visualizer will be more responsive and performant, providing a better user experience.
Deploying and Testing the Visualizer
Deploying the isometric visualizer involves setting up a production environment, pushing the code to a server, and ensuring everything runs smoothly. The first step is to prepare your Laravel application for deployment. Start by running the following commands in your project directory:
composer install --optimize-autoloader --no-dev
php artisan storage:link
php artisan view:clear
php artisan config:cache
php artisan route:cache
php artisan event:cache
php artisan optimize
These commands optimize the autoloader, link the storage directory, clear the cache, and optimize your application. The --no-dev flag in the composer install command ensures that only production dependencies are installed.
Next, ensure your .env file is properly configured for production. Set the APP_ENV to production, and configure other necessary settings such as database credentials and environment-specific configurations.
For security, run the following command to disable the .env file in your production environment:
php artisan key:generateThis command generates an application key that is used for encrypting session data and other sensitive information.
To deploy your Laravel application, you can use Git to push your changes to a production branch, typically main or master. Alternatively, you can use a deployment tool like Capistrano or Laravel Envoyer for more automated processes.
After deploying, verify that your isometric visualizer works correctly by accessing it through your server’s domain name or IP address. Test various features of the visualizer to ensure that everything functions as expected. Check the browser console for any JavaScript errors and the server logs for PHP errors.
Finally, monitor your application’s performance and responsiveness. Tools like Google Lighthouse can provide valuable insights into how your visualizer performs in different environments and help you identify any bottlenecks or areas for optimization.
By following these steps, you can successfully deploy and test your isometric visualizer, ensuring it runs smoothly and performs well in a production environment.
Frequently Asked Questions
How do I install Tailwind CSS in a Laravel project?
Install Tailwind CSS by running npm install tailwindcss postcss autoprefixer, then update the tailwind.config.js to include your project’s directories and add Tailwind CSS to your webpack.mix.js file.
What are common errors when setting up an isometric visualizer with Tailwind CSS?
Common errors include missing dependencies, incorrect configuration in tailwind.config.js, and issues with the webpack.mix.js file not properly compiling Tailwind CSS.
Why use Tailwind CSS for an isometric visualizer instead of plain CSS?
Tailwind CSS offers rapid prototyping and flexibility, making it easier to design and adjust the user interface for an isometric visualizer compared to plain CSS.
Can I use Vue.js for the UI instead of Tailwind CSS in an isometric visualizer?
Yes, Vue.js can be used for the UI, offering dynamic and interactive components. However, Tailwind CSS provides styling utilities that simplify UI design.