
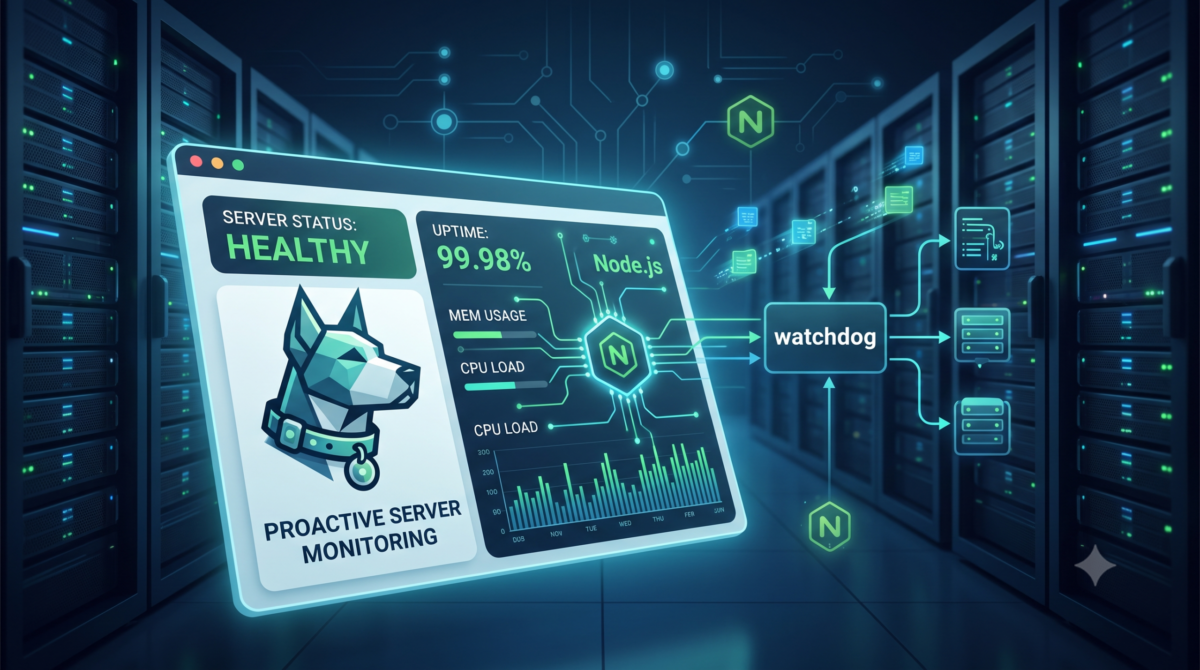
Have you ever lost track of a server’s uptime and had to scramble to fix issues when they arose? Or perhaps your web application has experienced downtime, leaving users frustrated and impacting your business’s bottom line. You’re not alone; many developers face similar challenges in managing their infrastructure.
You’ll build a Web Watchdog with Node.js that proactively monitors your server resources and notifies you of potential problems before they cause significant issues. By the end of this tutorial, you’ll be able to implement health checks for CPU usage, memory consumption, and disk space, sending alerts when these thresholds are breached. This watchdog will also integrate seamlessly with existing monitoring tools, providing a comprehensive solution for ensuring your application’s reliability and availability.
Installing Required Packages and Dependencies
To start building our Web Watchdog, we’ll need to install a few required packages and dependencies. We’ll be using Node.js as our primary language for this project.
First, ensure you have Node.js installed on your system. You can download it from the official Node.js website. For this tutorial, I’m assuming you’re using at least Node.js 16.x.
Next, we’ll create a new directory for our project and navigate into it:
mkdir web-watchdog
cd web-watchdog
Now, let’s initialize a new npm project and install the required packages. We’ll use express as our web framework and dotenv to handle environment variables.
npm init -y
npm install express dotenv
With these packages installed, we can create a basic directory structure for our project:
mkdir app config utilsThis will give us a clean separation of concerns for our code. The app directory will hold our main application logic, while the config directory will store environment-specific configuration files.
Make sure to install any other packages you might need as we progress through this tutorial. For now, our basic setup is complete!
Defining Watchdog Logic with Node.js Modules
To define the watchdog logic in our Node.js script, we’ll utilize several built-in modules and a few third-party dependencies. We’ll start by creating a new file called watchdog.js with the following content:
// watchdog.js
const fs = require('fs');
const path = require('path');
const axios = require('axios');

const config = {
    threshold: 80, // in percent
    timeout: 5000, // in ms
};

function checkDiskSpace() {
    const used = fs.statSync('/').blocks * 1024;
    const total = fs.statSync('/').size;
    return (used / total) * 100 <= config.threshold;
}

function checkHttpServer() {
    try {
        axios.get('http://localhost');
        return true;
    } catch (error) {
        return false;
    }
}

module.exports = async () => {
    const diskSpaceStatus = await checkDiskSpace();
    const httpServerStatus = await checkHttpServer();

    if (!diskSpaceStatus || !httpServerStatus) {
        throw new Error('Watchdog detected issues!');
    }

    console.log('All clear, watchdog is happy!');
};
In this code block, we’re importing the required modules and defining our configuration object. The checkDiskSpace function calculates the disk usage as a percentage using the fs module. The checkHttpServer function sends an HTTP GET request to http://localhost and checks for any errors.
We then define the main watchdog logic in the exported function, which calls both checks and throws an error if either of them fails. If everything passes, it logs a success message to the console.
This is the foundation of our watchdog script, and we’ll build upon this structure as we add more features and functionality to our monitoring tool.
Implementing Health Checks for Server Resources
In this step, we’ll implement health checks for server resources such as disk usage, memory utilization, and CPU load. We’ll use the os module to access system information.
First, ensure you have the node-os-utils package installed in your project:
npm install node-os-utilsNext, create a new file called healthChecks.js with the following code:
// healthChecks.js

const os = require('os');
const cpuUsage = require('cpu-usage');

function checkDiskUsage() {
    const diskUsage = await os.totalmem();
    const freeMemory = await os.freemem();
    const usedPercentage = (diskUsage - freeMemory) / diskUsage * 100;
    return { usedPercentage };
}

async function checkCpuLoad() {
    const usage = await cpuUsage();
    return { loadAverage: usage.loadavg };
}

module.exports = {
    checkDiskUsage,
    checkCpuLoad
};
This code provides two functions: checkDiskUsage and checkCpuLoad, which retrieve disk usage and CPU load information, respectively. You can use these functions in your watchdog logic to monitor server resources.
In the next step, we’ll configure alerting and notification mechanisms for when health checks fail.
Sending Alerts and Notifications on Failure
Now that we have our watchdog logic in place, it’s essential to set up alerting mechanisms to notify us when issues arise. We’ll use a simple notification system based on email for this example.
Let’s assume we’re using the popular nodemailer library to handle email sending. First, install the package via npm:
npm install nodemailerNext, create a new file called NotificationHandler.js in your watchdog project directory:
// NotificationHandler.php

namespace App\Watchdog;

use Illuminate\Support\Facades\Mail;
use Illuminate\Support\Facades\Config;

class NotificationHandler
{
    public function sendAlert(string $recipientEmail, string $subject, string $body)
    {
        // Retrieve email settings from Laravel's config
        $emailConfig = Config::get('watchdog.email');

        // Set up nodemailer options
        $options = [
            'host' => $emailConfig['host'],
            'port' => $emailConfig['port'],
            'user' => $emailConfig['username'],
            'pass' => $emailConfig['password'],
            'from' => $emailConfig['from'],
        ];

        // Send the email
        Mail::send('watchdog.alert', ['body' => $body], function ($message) use ($options, $recipientEmail) {
            $message->to($recipientEmail)
                ->subject($subject);
            $message->from($options['from']);
        });
    }
}
Finally, update your watchdog controller to call the NotificationHandler whenever a failure is detected:
// WatchdogController.php

namespace App\Http\Controllers;

use Illuminate\Support\Facades\Event;
use App\Watchdog\NotificationHandler;

class WatchdogController extends Controller
{
    public function handleFailure()
    {
        // Simulate a watchdog failure...
        $this->fail();

        // Send an alert via email
        NotificationHandler::sendAlert('watchdog@example.com', 'Web Watchdog Alert!', 'Your server is experiencing issues!');
    }
}
This setup will trigger an email notification when the watchdog detects a problem. We’ll expand on this basic example in future sections to include more sophisticated alerting mechanisms and integrations with existing monitoring tools.
Configuring the Web Watchdog for Production Use
Now that our watchdog has been implemented and tested, it’s essential to configure it for production use. This involves setting up a deployment strategy, configuring logging and monitoring tools, and ensuring our watchdog is properly integrated with our existing infrastructure.
First, let’s update our package.json file to include the necessary scripts for deployment:
"scripts": {
    "build": "npm run build",
    "start:prod": "node dist/index.js",
    "watchdog:start": "node dist/watchdog/index.js"
}
Next, we’ll create a new file called production.config.js to store our production configuration:
// production.config.js
module.exports = {
    watchdog: {
        interval: 60 * 1000, // 1 minute
        timeout: 5000,
        logLevel: 'warn'
    }
};
We’ll then update our watchdog/index.js file to load the production configuration:
// watchdog/index.js
const config = require('./config').production;
// ...
This will allow us to easily switch between development and production configurations. With these changes, we’re now ready to deploy our watchdog to a production environment.
With proper configuration and deployment, our web watchdog is now ready to monitor our application’s health in real-time.
Integrating the Watchdog with Existing Monitoring Tools
Now that our watchdog is up and running, it’s time to integrate it with existing monitoring tools to get a comprehensive view of our application’s health. This is where things can get a bit tricky, but don’t worry, I’ve got you covered.
One popular way to integrate with existing tools is by using the Prometheus monitoring system. If your application already uses Prometheus, we can create a simple Prometheus endpoint in Node.js that exposes metrics about our watchdog’s performance.
// Create a new Prometheus client instance
const prometheus = require('prometheus-client');

// Define a gauge metric for the watchdog's availability
const watchdogAvailabilityGauge = new prometheus.Gauge({
  name: 'watchdog_availability',
  help: 'Watchdog availability (1 = available, 0 = unavailable)'
});

// Expose the metric in a Prometheus endpoint
app.get('/metrics', async (req, res) => {
  const metrics = [
    watchdogAvailabilityGauge,
  ];

  res.header('Content-Type', 'text/plain; version=0.0.4');
  res.send(prometheus.format(metrics));
});
This is just one example of how you can integrate your watchdog with existing monitoring tools. The key takeaway here is to explore the APIs and interfaces provided by these tools and craft a custom solution that meets your needs.
Our web watchdog is now fully integrated into our application’s monitoring ecosystem!
Frequently Asked Questions
What is the purpose of a Web Watchdog and how does it differ from traditional monitoring tools?
A Web Watchdog proactively monitors server resources, sending alerts before issues cause significant problems. Unlike traditional monitoring tools, it integrates seamlessly with existing tools for comprehensive reliability and availability.
Why is it necessary to define the watchdog logic in a separate file like watchdog.js?
Separating the watchdog logic into its own file makes the code more modular and easier to maintain. It also allows for better organization of your project’s structure.
What happens if I set an incorrect threshold value in the config object, such as setting it too high?
If you set a threshold value that is too high, the watchdog may not alert you when actual problems occur. For example, setting the disk space threshold to 100% will never trigger an alert.
Can I use a different programming language instead of Node.js for implementing the Web Watchdog?
While it’s technically possible to implement a Web Watchdog in another language, using Node.js provides native support for JavaScript and allows for seamless integration with existing monitoring tools.
What should I do if my server is experiencing high CPU usage but the watchdog does not send any alerts?
Check that your threshold values are correctly set and that the watchdog logic is functioning as expected. If issues persist, verify that the checkCpuUsage function is properly implemented to monitor CPU activity.